Analyzing Data
Our final step is to analyze the data using network analysis to uncover thematic areas within the Medieval Art collection.
We have a dataset containing 1725 unique pairs of tags. By transforming this dataset into a network graph, we can visualize how terms relate to one another:
- Nodes represent individual tags.
- Edges represent co-occurrences of tags within the same object, indicating a thematic connection.
- Weights reflect how often each tag pair appears together.
While the full details of network construction are beyond the scope of this workshop, you can create and explore network graphs using tools like Gephi. The processed network data is available in the project repository as network_medieval_art_tags.gexf.
The GEXF (Graph Exchange XML Format) is a widely used format for storing and sharing network graphs. It is structured using XML, making it both human-readable and compatible with various network analysis tools like Gephi and Cytoscape.
Visualizing the network
To better understand our network, we need to visualize how terms are connected. A graph layout allows us to represent nodes (tags) and edges (relationships) in a structured way, making it easier to explore clusters, central terms, and thematic areas.
There are multiple tools available for network visualization, ranging from desktop applications to web-based platforms:
- Gephi (desktop | Gephi Lite) – A powerful open-source tool for network analysis.
- Cytoscape (desktop) – Commonly used in bioinformatics and large-scale networks.
- Retina (web-based) – A browser-friendly tool that allows interactive exploration.
For this workshop, we will explore the network using Retina, which enables interactive exploration directly in your browser.
Unlike traditional network visualization tools, Retina works dynamically through URL parameters, making it function similarly to a Web API. Instead of manually adjusting settings in a graphical interface, Retina allows users to modify the view using URL parameters. These parameters control layout, node size, color attributes, filtering, and focus points—all without needing a separate backend. Because the graph is rendered directly in the user’s browser, all changes happen client-side, just like API calls retrieving data.
This means we can construct Retina URLs dynamically to generate custom views of our network, making it a powerful tool for API-driven scientific research.
By tweaking the URL, you can reconfigure the network visualization dynamically, much like calling an API with different query parameters!
The layout for this visualization was prepared in Gephi and then exported to Retina, but you can also import the raw GEXF file into Retina and generate a similar graph from scratch.
You can also explore the network in a new tab by clicking here
The network is fully interactive, allowing you to zoom in and out to examine specific areas or use the search bar to locate a particular term. Each node represents a tag from the dataset, and its color and size reflect important network properties.
- Color is determined by the modularity class, which groups related terms into thematic communities. Terms that frequently appear together in the dataset will tend to cluster, forming distinct regions in the network.
- Size is based on Eigenvector Centrality, a measure of influence within the network. Larger nodes indicate terms that serve as key connectors, linking multiple themes together. For instance, if a term like “Christ” or “Virgin Mary” appears prominently, it suggests that it plays a central role in shaping the overall structure of the dataset.
To further customize your view, open the menu on the left and experiment with color and size settings to highlight different attributes. By adjusting these parameters, you can gain new insights into how terms interact and uncover unexpected thematic relationships within the Medieval Art collection.
Exploring the network
One of the challenges of using networks as a data visualization tool is the risk of creating a “hairball” — a dense, cluttered graph with too many connections, making it difficult to interpret patterns or insights. To address this issue, Retina offers built-in features that allow us to explore the network in more detail and isolate key themes.
Isolate communities
Since each community in our network represents a thematic area, we can filter specific communities to explore the terms they contain and their connections to the broader network.
A straightforward way to isolate communities is by using Retina’s “Explore” feature:
- Open the Explore menu.
- Click on a community to highlight it.
- Use the filter options to hide other nodes and focus on a single thematic area.
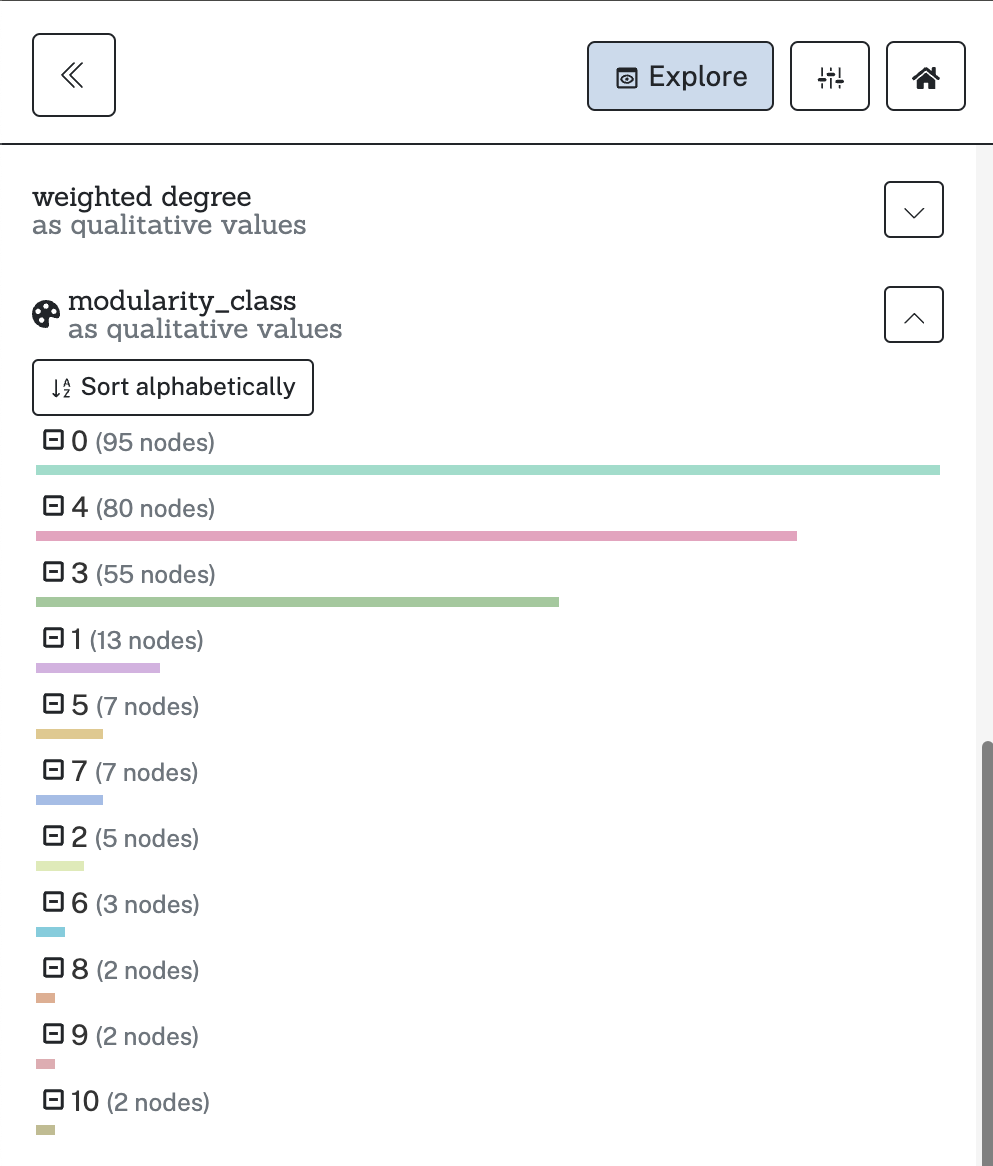
Our analysis reveals 11 distinct communities, with three major groups containing most of the terms. Some communities are very small, consisting of just two or three nodes.
To explore this further, let’s isolate the largest community (Community 0) and analyze its structure in more detail:
With this filter applied, we can better interpret the network. Community 0 appears to represent “Animals, Plants, and Objects”, a broad category that connects mythical, religious, and historical figures with specific objects such as flowers, horses, and medallions.
Spotlight on “Horses”
To further explore connections within Community 0, let’s isolate the term “Horses” using the search bar in Retina.
This reveals that “Horses” acts as a bridge between multiple thematic areas. It links to mythical and historical figures like Achilles, Alexander the Great, Andromache, Hercules, and Saint George. Additionally, it connects with other communities, including Community 4 (centered on “Men” and “Women”) and Community 3 (focused on “Christ” and “Virgin Mary”), highlighting its broad thematic relevance.
Beyond connections, we can examine network metrics in the explore menu to better understand the role of “Horses” in the dataset. Below is a breakdown of key values and their meaning in the network:
| Metric | Value (Horses) | Meaning in Context |
|---|---|---|
| Eccentricity | 3 | “Horses” is relatively central, as its longest shortest path to another node is just 3 steps |
| Closeness Centrality | 0.56 | A higher closeness value means “Horses” is well positioned, with short paths to many other nodes. |
| Harmonic Closeness Centrality | 0.622 | Accounts for disconnected components, reinforcing the influence of “Horses” in the network. |
| Betweenness Centrality | 0.041 | Low betweenness suggests that while “Horses” connects communities, it is not a major bridge. |
| Weighted Degree | 174 | “Horses” has an exceptionally high number of connections, making it a key thematic term. |
| Modularity Class | 0 | It belongs to the largest thematic cluster in the network. |
| Stat Inf Class | 14 | Based on Statistical Inference, this classification suggests “Horses” belongs to a statistically significant thematic grouping. |
| Clustering Coefficient | 0.167 | A low coefficient indicates “Horses” is not densely interconnected but still plays a linking role. |
| Triangles | 381 | The node appears in many tightly interconnected groups, suggesting strong thematic associations. |
| Eigenvector Centrality | 0.584 | High influence, indicating strong connections to other important terms. |
This approach can be applied to any term in the network—by isolating a node and interpreting its metrics and connections, we can uncover hidden patterns and thematic relationships within the collection.
Some preliminary insights
After this brief exploration, we can draw several preliminary conclusions about the structure of thematic areas in the Medieval Art collection. These insights not only help us understand how objects are categorized but also highlight broader patterns in cultural and religious representation.
1. Thematic Areas Are Well-Defined but Overlapping
The network is clustered into 11 distinct communities, each representing a thematic area. From those, we can identify three major groups:
- Community 0 (Animals, Plants, and Objects) is a broad category that links religious, mythical, and historical figures to specific objects like horses, flowers, and medallions.
- Community 4 (Men & Women) represents human figures and social roles, and overlaps with religious themes.
- Community 3 (Christ & Virgin Mary) is highly centered on religious iconography.
Other communities are highly specialized and relatively isolated from the rest of the network. Community 6, for example, is composed of just three nodes—Greek, Coptic, Documents—suggesting a connection to textual traditions rather than visual themes. Similarly, Community 8 consists only of Hands and Feet, likely indicating specific iconographic elements, while Community 9 pairs Dolphins with Female Nudes, pointing to a connection between aquatic imagery and representations of the human body.
2. Certain Terms Act as “Bridges” Between Communities
While the network is divided into distinct thematic areas, some terms serve as key connectors, linking multiple communities and acting as conceptual bridges.
One clear example is “Horses”, which appears in different contexts—connecting historical figures such as Alexander the Great, Achilles, and Saint George, while also maintaining links to broader thematic groups like Men and Women and Religious Figures. Similarly, Christ and Virgin Mary are central nodes within religious iconography, reinforcing strong intra-community ties. On the other hand, Men and Women function as structural connectors, bridging religious, mythological, and historical figures, reinforcing their role as central elements in medieval art representation.
3. The Network Reveals How Art Metadata Is Structured
This exploration is not just about historical themes—it also shows how the Met Museum categorizes its objects. The fact that certain terms cluster together may reflect institutional categorization practices, rather than just organic historical connections.
4. Unexpected Connections & The Importance of Structure
Highly connected nodes such as “Men,” “Women,” and “Christ” dominate the network, but less connected nodes can still reveal meaningful insights. A prime example is “Noah”, a relatively isolated node that still exhibits a high clustering coefficient (0.857), indicating that it forms tight local connections despite its limited reach within the broader network.
Examining Noah’s connections reveals both expected and surprising relationships. Unsurprisingly, Noah is linked to Moses, another Old Testament figure. However, an unexpected connection emerges between Noah and several Christian themes, including Coronation of the Virgin, Madonna and Child, and Virgin Mary.
This suggests that, within this dataset, Noah is not solely categorized within Old Testament narratives but also appears in contexts related to Marian iconography. This is surprising because Noah is typically associated with Genesis and the Flood rather than Christian representations of Mary. Why does he appear in relation to the Coronation of the Virgin? Could this be due to specific artistic traditions, metadata decisions, or broader iconographic patterns? This observation serves as a potential starting point for further research, demonstrating how network analysis can highlight overlooked connections and generate new research questions.
Wrapping Up
This exploration of the network has revealed key thematic clusters, influential terms, and even unexpected connections within the Medieval Art collection. By structuring metadata as a network, we uncovered both historical patterns and institutional categorization practices, highlighting the interplay between data and interpretation.
While this approach provides a powerful way to visualize and analyze relationships at scale, it also raises important questions: Do these clusters reflect historical realities, or are they shaped by modern cataloging decisions? How might additional data—such as object provenance, artistic schools, or iconographic traditions—further refine our understanding?
As we wrap up, we’ll take a step back to reflect on what we’ve learned and consider the broader implications of using APIs and network analysis for cultural heritage research.